
Tackling the enormous task of explaining big data in a visually appealing way is no easy feat, Gerard Ward finds.
The permanent exhibition at ArtScience Museum, Future World, brings a lot of what the younger generation loves about digital into the physical space – and back again. One exhibit lets kids scan in coloured in trucks, spaceships and buildings that are thrown on display on a big wall projection in 3D.
The newest generation are fully entrenched in the world with the internet, and wouldn’t know anything without it being in existence. But behind all of the fun and games of apps, websites and such, there’s a whole world of data – an incredible amount of data. From MRT cards and Facebook posts to weather patterns, what can data do for us, our cities and beyond?
This is where the current travelling exhibition at the same museum, Big Bang Data, is trying to answer through the use of a ton of data. Data can seem very cold and purely numeric in nature – and at times overwhelming, considering that for every second that passes, we create new data. There are 40,000 search queries every second just on Google alone – that’s 3.5 billion a day. You’ll most likely nod your head and agree hearing that 204 million emails are sent every minute.
What this exhibition tries to do is visualise the many aspects in which big data in its many forms can be understood. One exhibit looks at the timeline of data capacity, from the old punch cards of the 50s and cassette tapes in the 80s to USB drives. One art piece takes financial market trade and displays it like a constellation of living stars – with real-time data changing the brightness and interactions with other stars depending on trade activity. ‘I think to try to provide the tools for people to be able to engage in the conversation around [data] is very important,’ José Luis de Vicente, one of the curators of the exhibition tells me. ‘And I think the exhibition is a good language and device for that.’
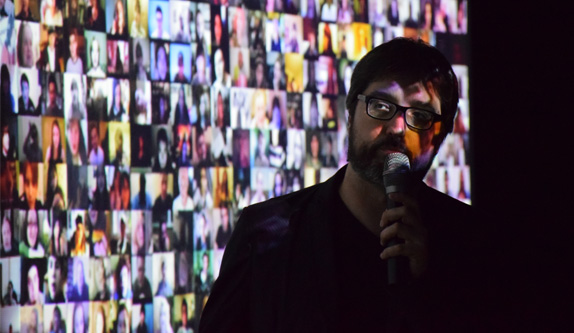
José Luis de Vicente in front of a screen showing thousands of YouTube vlogs.
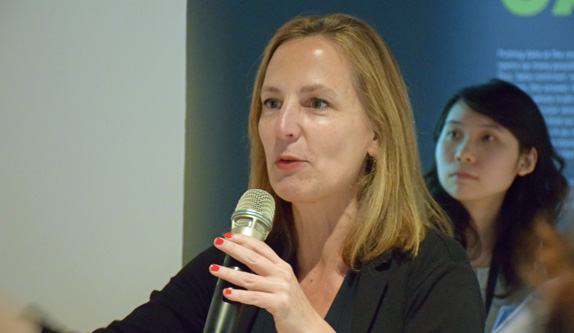
Olga Subirós, the other curator for the exhibition, talks about her background as an architect as an introduction to how art and data came together. ‘For the last 20 years I’ve been working very closely with creators, and also I’ve worked with artists,’ she says. ‘I found so many exhibitions that really stuck to their discipline, like “this is an art exhibition”, “this is a science exhibition” or “this is a historical exhibition”. They were like non-connected walls, and no exhibitions were talking about contemporary issues that have this historical relevance to them.’
Olga came to José when she was looking for someone to help visualise this unity between data and art. José has worked on projects previously that took data from city councils – something that’s now commonplace, but a decade ago was not easy – to visualise how traffic flows through Madrid for example, or bikes that travel through Barcelona on a given day – his team even mapped out an entire year of pollution in Madrid. Better understanding how a city acts and reacts can inform us on how to make systems work for us, not against.
Working together with the Centre de Cultura Contemporània de Barcelona, they eventually formed this collection of exhibits to better explain the different facets of data in our lives.
Most of what we hear lately with big data concerns leaks like the recent Panama Papers – demonstrated how this topic is ever-changing. ‘One of the things we have to incorporate is surveillance and social surveillance,’ José says. ‘With the Panama leaks, it’s another big example of how the more data there is, the harder it is to keep it secret.’
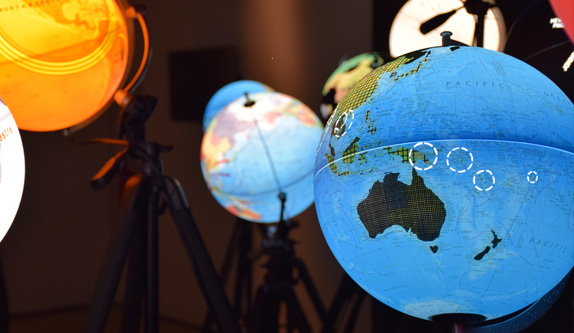
Olga Subirós explains the map of various underground tunnels linked between countries.
The importance and role of data in cities and the world today have also been a key driver on the conversation, especially here in Singapore. One of the exhibitions has three large touchscreens with data donated from Singaporean companies such as SingTel, visualising data in a way we can see on a map of country – such as the amount of traffic SingTel has during a 24-hour period based on the areas. ‘Those three screens was a collaboration with MIT Senseable City Lab, and was a milestone in terms of visualising data in a city, and it changed very much the perception of how to address city issues,’ Olga says. ‘That’s why it makes so much sense because Singapore was leading this area.’
One interesting exhibit comes from the technology that sits within shop windows, analysing passers-by. You may not have noticed it before, but not only can this technology detect whether you are directly looking at a shopfront, it uses algorithms to detect a person’s gender and age. José says when this was shown to people seeing the exhibition in Barcelona, ‘it’s suddenly uncomfortable’ for those who didn’t realise this was happening.
The worst part is the inaccuracies – a woman walking past is detected as a man, for example. This demonstrates how cold algorithmic analysis can’t be relied upon 100 percent. ‘Everyone who runs this kind of system says “Yeah, but it’s anonymised data and we’re not tracking anybody, we’re not interested in that”,’ José explains. ‘Explaining that to a group one day during a visit, I suddenly realised this is also a smart city, you know? A smart city is not only sustainable, tech-savvy, and energy efficient ideas, it’s a city acting in ways which sometimes you’re not expecting to be subjected to.’
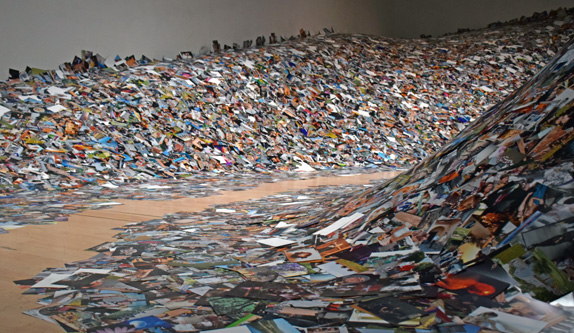
’24 Hrs in Photos’ by Eric Kessels.
This led to the discussion of free wifi in shopping centres – something Singapore and most cities around the world offer. ‘When you go to a shopping mall, and you want to get on wifi, and there’s free wifi that requires you to give access with your Facebook profile, the shopping centre’s giving you free wifi,’ José begins. ‘But you’re giving them every detail about your profile on Facebook, you know, as a potential customer. Then of course, is it worth it, really?’
‘We are in a situation where we’re not putting a price [on anonymity], and we’re not having this discussion,’ José says. He tells me about how the perception of “I have nothing to hide” should really be “Actually, you have no idea you have nothing to hide”. ‘Once you’re in, you don’t know in three years down the line, or five or even ten years down the line, how your circumstances are going to change,’ he says. ‘And the information that you gave at a specific moment in time may look completely different once your circumstances change.’
‘It’s not just about what is going to happen in the future, it’s going on right now,’ Olga adds. ‘In the United States, if you want a mortgage online, you have to also enter your Facebook profile. It’s not just about tracking you and seeing who you are, but who are your friends, relatives, and the risks you have to calculate risks.
‘Why is it legal? It’s almost illegal, because technology goes so fast that there’s no policies to balance that. This is the aim of the exhibition.’

‘Data.Tron’ by Ryoji Ikeda.
While it all seems a bit daunting, this isn’t what the exhibition is all about. Trying to describe something as huge as big data to those who aren’t familiar with all its facets is a challenging topic – I’m interested in this, and there at times I’m perplexed.
I ask about the favourite of the pieces in the exhibition – a dumb question to ask the curators, I realise as I say it. Olga’s answer to one of the many she mentions is 24 Hrs in Photos by Eric Kessels – a gorgeous wave of every single photo uploaded to the photo website Flickr in 24 hours. ‘That mountain of photos really…when visitors have to step on the photos, and maybe there is a baby’s face there, or a couple kissing, then they realise what it means to upload all these intimate photos.’
Big Bang Data is running at ArtScience Museum until 16 October.


